All updates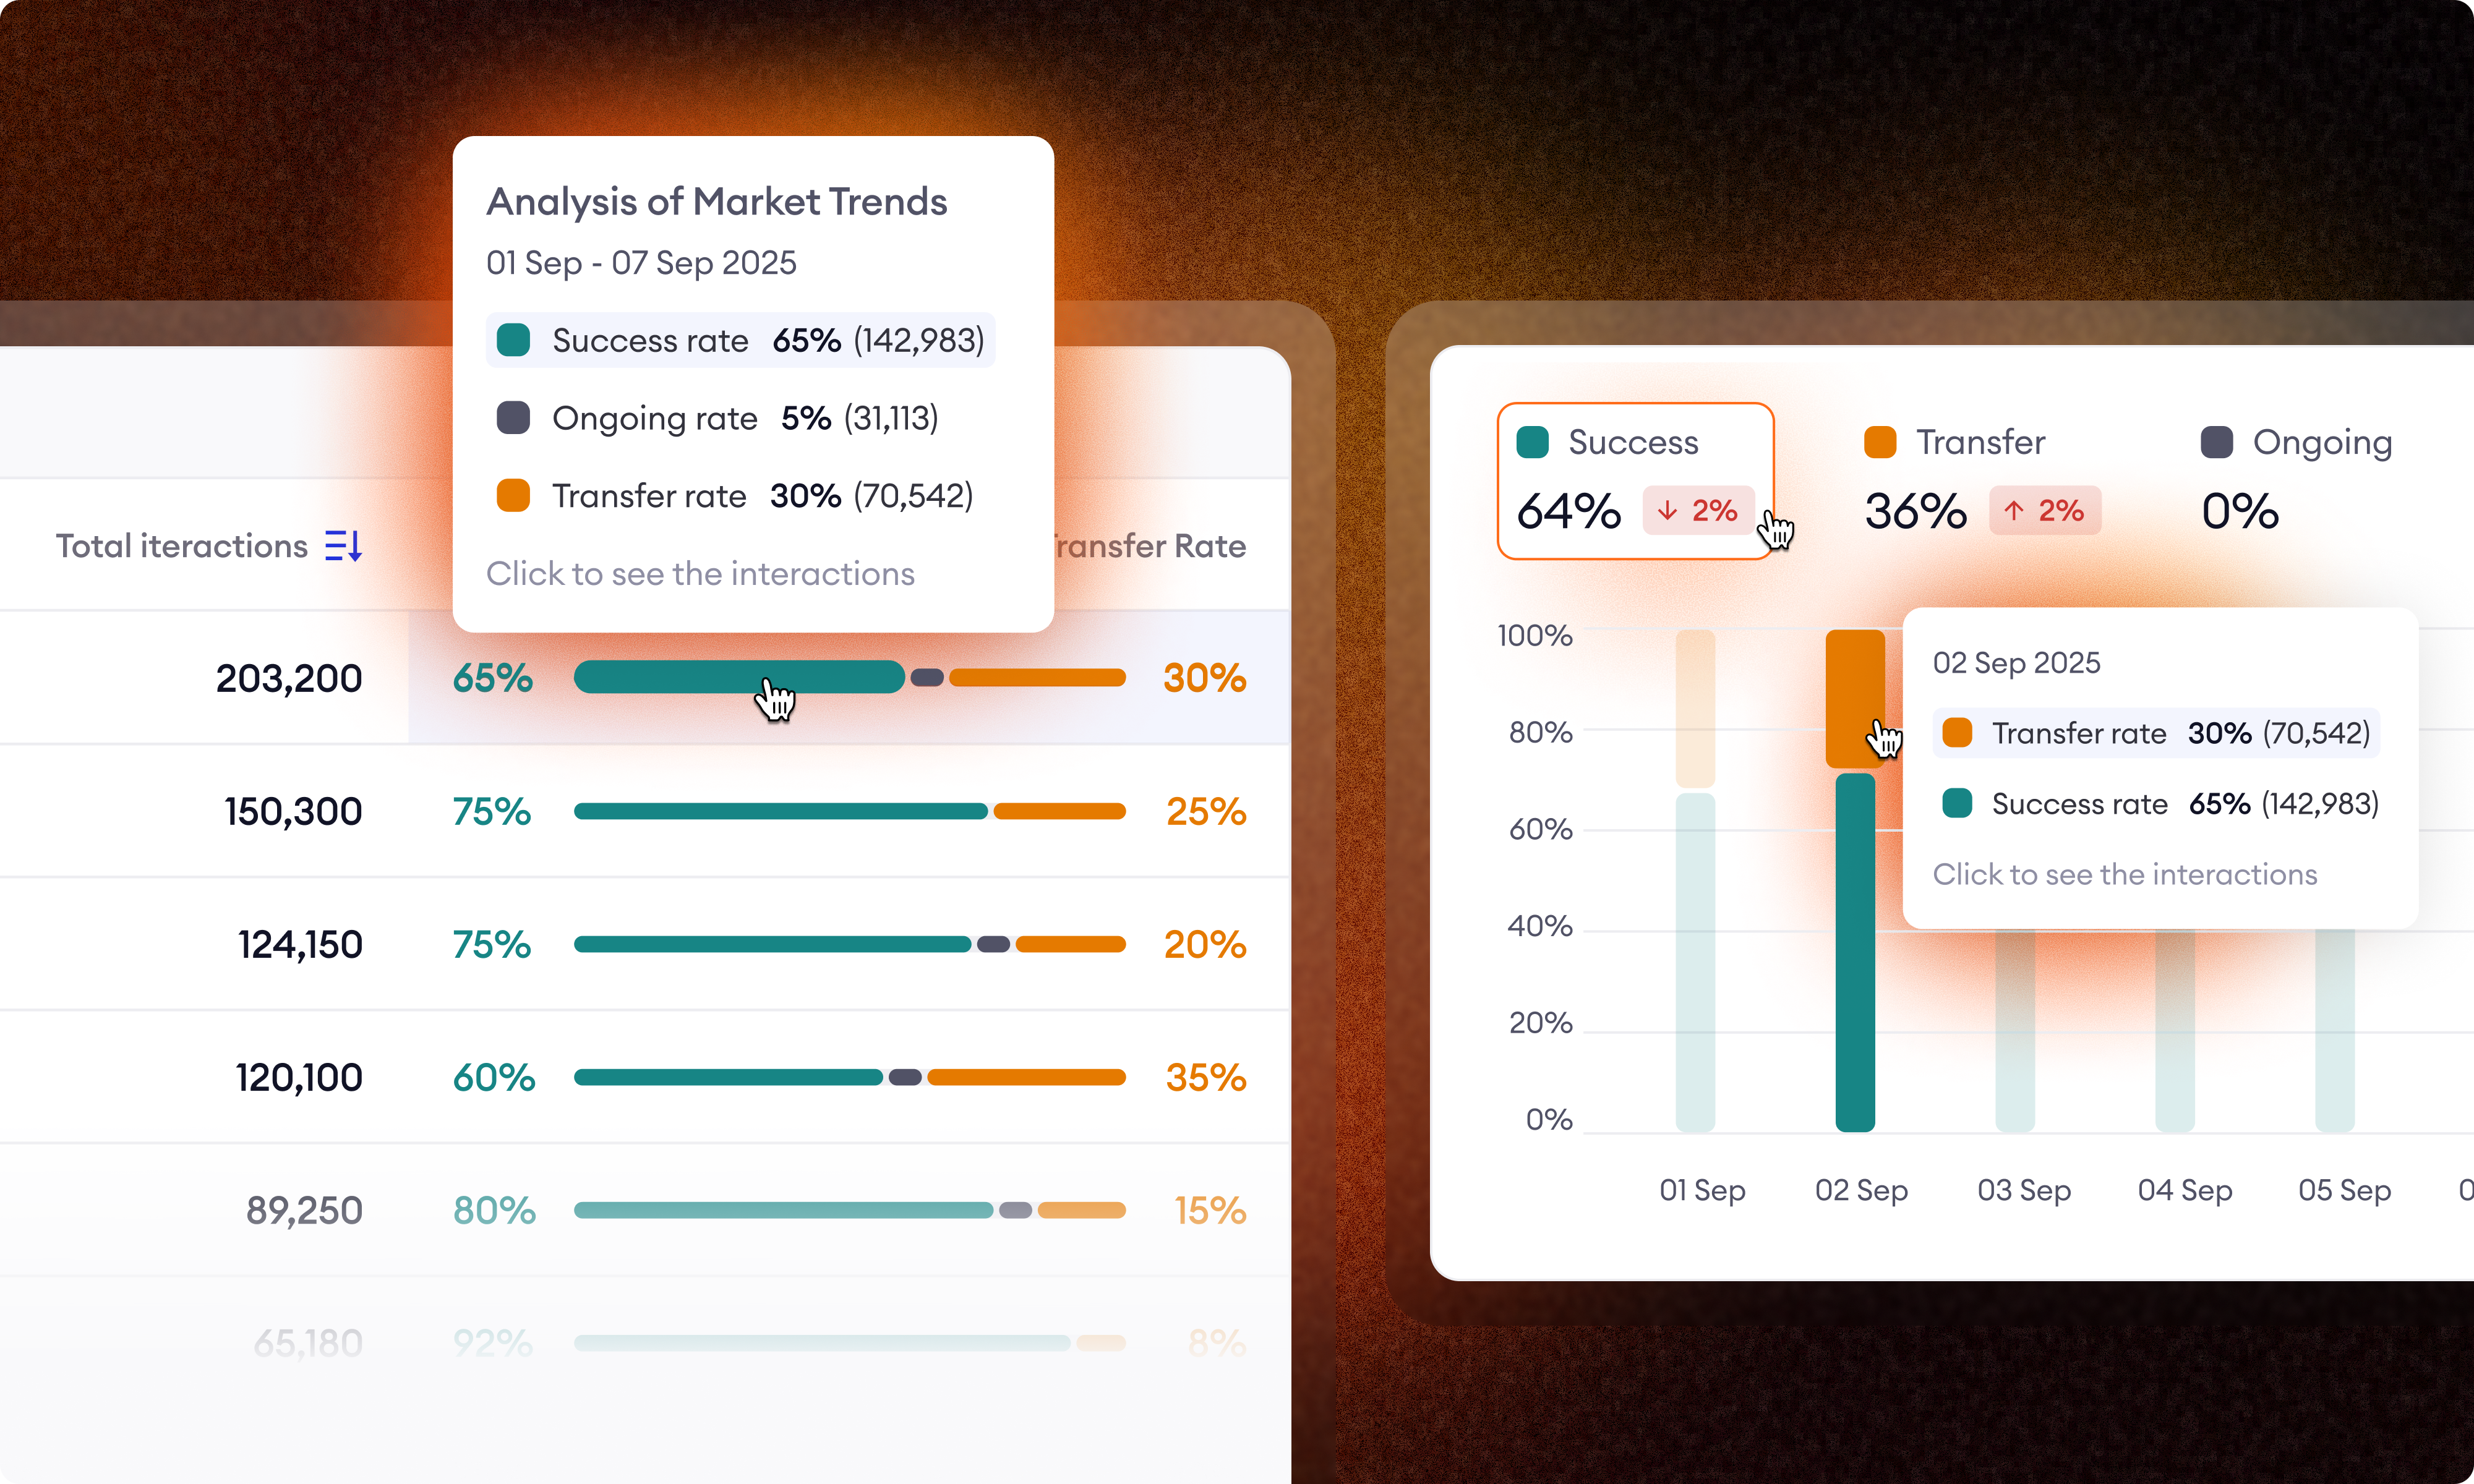
Supervisor
Interactive graphs & Interaction totals
February 18, 2026
With this update we introduce clickable charts and interaction totals to the Supervisor Dashboard. These features allow you to move from a high-level trend to the underlying conversations with a single click and see the exact volume behind every percentage
Key Updates
- Interactive Graphs: Graph segments and percentage indicators are now clickable. Selecting a specific data point redirects you to the Supervisor Interaction List with the corresponding filters - such as date range and interaction status - automatically applied
- Interaction Totals: Hovering over charts or percentages now displays the absolute number of interactions alongside the percentage (e.g., Transfer rate: 30% ( _1,542_ )). This provides immediate context on the scale of the data without requiring manual calculations
Stop leaving your processes to probability
See how Flows and Decision Engine guarantee that every step of your process runs exactly as designed.